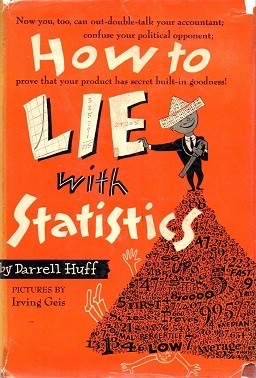
Cover of How to Lie with Statistics

How to Lie with Statistics

3 ideas

Buy on Amazon
  1. Average hides which measure you mean

    The word 'average' can refer to the mean, median, or mode, which often differ substantially, so a figure can be technically true yet misleading when the speaker picks whichever version flatters their case. With a skewed distribution like incomes, the mean is pulled upward by a few large values while the median and mode stay low, so stating an unlabeled 'average' lets the same data support opposite impressions.

  2. Unstated sampling error voids a difference

    Any figure drawn from a sample carries a probable error, and a reported difference smaller than that margin is meaningless even though it is printed as a precise number. A test score or survey result stated without its range of error invites readers to treat chance fluctuation as a real finding.

  3. Five questions to interrogate a statistic

    To test a suspicious statistic, ask: who says so (watch for bias or a conscious slant), how does he know (was the sample adequate and unbiased), what is missing (the base rate, the error range, or a comparison figure), did somebody change the subject (whether the thing counted matches the thing claimed), and does it make sense. Applying these in sequence exposes most distortions without requiring technical expertise.

Save ideas and give them a thumbs up or down in the app